Analytics without a tracker: everything your access log already knows
Traffic, countries, devices, referrers, error rates and slow pages — all of it is sitting in a file nginx is already writing. No JavaScript, no third party, no consent banner. Here is how to get it
In this essay
Every request to your website is already being written to a file, with a timestamp, a path, a status code, a byte count, a referrer, a user agent and the client's address. That is roughly everything a basic analytics product will tell you, and you are storing it whether or not you ever read it.
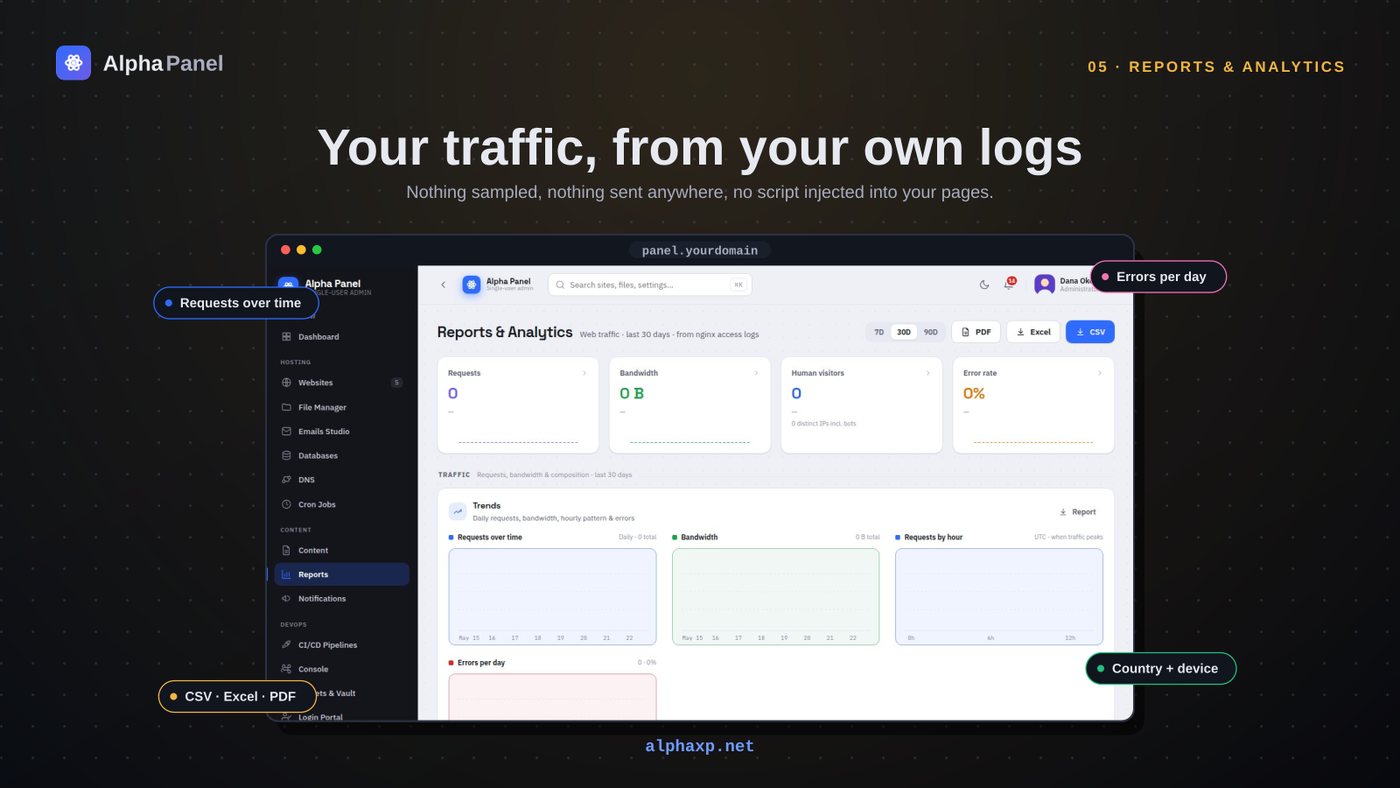
The Reports screen in this panel is built entirely from that file. No script tag on your pages, no cookie, nothing leaving the server, and nothing to disclose in a privacy policy beyond the server logs you already keep. This is what that gets you, what it costs, and the three things a log genuinely cannot answer.
What one log line contains
A default combined-format line looks like noise until you take it apart. Every field is a dimension you can group by.
203.0.113.7 - - [06/Aug/2026:14:22:31 +0000] "GET /pricing HTTP/2.0" 200 18432
"https://news.example.com/roundup" "Mozilla/5.0 (iPhone; CPU iPhone OS 17_5…)"- The address gives you a country, via an offline geolocation database
- The timestamp gives you every time series you will ever want
- The path gives you top pages, and section rollups if you group prefixes
- The status gives you error rate, and which URLs are producing the errors
- The byte count gives you real bandwidth, per page and in total
- The referrer gives you where people came from, including search versus social
- The user agent gives you device class, browser and — importantly — bots
That is six of the seven panels on a typical analytics dashboard, from a file you are not currently reading.
The one field you have to add, today
There is a gap, and it is the single most important practical point in this article. The default log format does not record which virtual host served the request. On a server with one site that does not matter. On a server with sixteen, it means every line is anonymous with respect to the thing you most want to group by.
The fix is one token in the log format — vhost=$host — and it takes thirty seconds. The catch is that it only applies to lines written after you make the change. There is no backfill. Nothing can reconstruct which of your sites served a request logged last week.
log_format alpha '$remote_addr - $remote_user [$time_local] '
                 '"$request" $status $body_bytes_sent '
                 '"$http_referer" "$http_user_agent" '
'vhost=$host rt=$request_time';While you are in there, add $request_time. It turns the same file into a performance record — slowest pages, and the ability to see the moment a deploy made something worse — which is otherwise a separate tool entirely.
Geography without an API call
Turning an address into a country is the one part that needs outside data. The panel uses an offline database file, queried locally, so no address ever leaves the machine and there is no per-lookup latency or quota.
One deployment detail matters here: that database is around 70 MB and comes with licence terms, so it cannot live in the repository. Provisioning downloads it on install, and there is a keyless fallback source for boxes without credentials. The general shape — large licensed data files are provisioned, not committed — applies to more than geolocation.
Country-level is as far as we take it. City-level accuracy for consumer addresses is poor enough that it produces confident, wrong answers, and a map that says your visitor is in the geographic centre of a country is a map showing you the database's fallback coordinates rather than a fact.
Bots, and why your numbers are wrong without this
A meaningful share of raw log lines on any public site are not people. Search crawlers, uptime monitors, security scanners, feed readers, and a long tail of things that never identify themselves honestly. Counted as visitors, they inflate everything and they do not inflate it evenly.
The panel classifies obvious crawlers from the user agent and reports them separately rather than silently dropping them, because "how much of my traffic is bots" is itself a useful number — a sudden change in it usually means either a new crawler discovered you or someone is scanning you.
What no log-based approach can do is catch a bot that presents itself as Chrome on Windows and behaves plausibly. If a number matters commercially, treat log-derived visitor counts as an upper bound.
Sessions, uniques, and the honest answer
Here is where a log stops being enough, and it is worth being blunt rather than inventing a metric.
A log has no session concept. You can approximate one by grouping requests from the same address and user agent within a time window, and that approximation is fine for trend — it is directionally right and it moves when your traffic moves. It is not fine as an absolute number, because two people behind the same office connection on the same browser version are one bucket, and one person on a phone moving between wifi and mobile data is two.
Unique visitors have the same problem, worse. Without a cookie there is no identity, and without identity "unique" means "distinct address plus agent", which is a different quantity with a similar name.
The panel therefore reports requests and pages as the primary numbers, because those are exactly true, and shows approximated visitors clearly labelled as approximate. A metric with a caveat is more useful than a confident number that is wrong by an unknown amount.
Report the number you can actually compute. Label the one you estimated.The rule that decided this screen's design
Reading it fast enough
The naive implementation reads the whole log on every page view, and works beautifully until the log is a gigabyte. Three things keep it quick.
- Parse from the end backwards for recent windows — the last hour is at the tail, and reading the first 900 MB to find it is pure waste.
- Aggregate once per render into buckets, not per chart. Six charts over one pass, never six passes.
- Cache the expensive rollups with a visible timestamp, so a stale number is obviously stale rather than quietly wrong.
Rotation is the other half. Logrotate compressing yesterday's file means anything looking further back has to read gzip as well as plain text, which is easy to forget and produces the specific bug where all your history vanishes at midnight.
Errors are the report people skip
The status-code panel is the one most people scroll past, and it is the one most likely to be worth money. A 404 rate that climbs after a deploy means you renamed something and did not redirect it. A cluster of 404s on one path with a real referrer means somebody is linking to you and landing on nothing — the cheapest traffic you will ever recover.
The panel groups errors by URL rather than by count alone, and keeps the referrer alongside, because a 404 with an external referrer and a 404 from a scanner probing for admin panels are the same status code and completely different problems. One needs a redirect. The other needs nothing at all, and treating them as one number gets both wrong.
The subtler case is the soft 404 — a page that returns 200 while telling the visitor it does not exist. Search engines treat those as real pages and index them, your error report shows nothing wrong, and the only symptom is a slow decline in how your site is understood. A log will not catch that on its own; it needs the page itself to be honest about its status code. That is a content bug, not an analytics one, but the report is where you notice the shape of it.
Where this loses to a real analytics product
Being fair about the trade: a JavaScript tracker sees things a server never will. Scroll depth. Time on page. Clicks that do not navigate. Anything happening inside a single-page application after the first load. Form abandonment. If your questions are about behaviour within a page, a log cannot answer them and no amount of parsing will change that.
What a log gives you instead is completeness and honesty. It sees every request including the ones an ad blocker would have suppressed, it sees your API and your feeds and your images, it never mis-fires because a script failed to load, and it does not send your visitors' behaviour to a company whose business is that data.
For "is my traffic growing, where is it coming from, what is popular, what is broken and how fast is it", the file you already have is enough. That covers most of the questions most sites actually ask.


Uptime monitoring that tells you what actually happened
Every panel shows a green dot. Almost none can tell you how long you were down last month, or that a certificate expires on Tuesday.
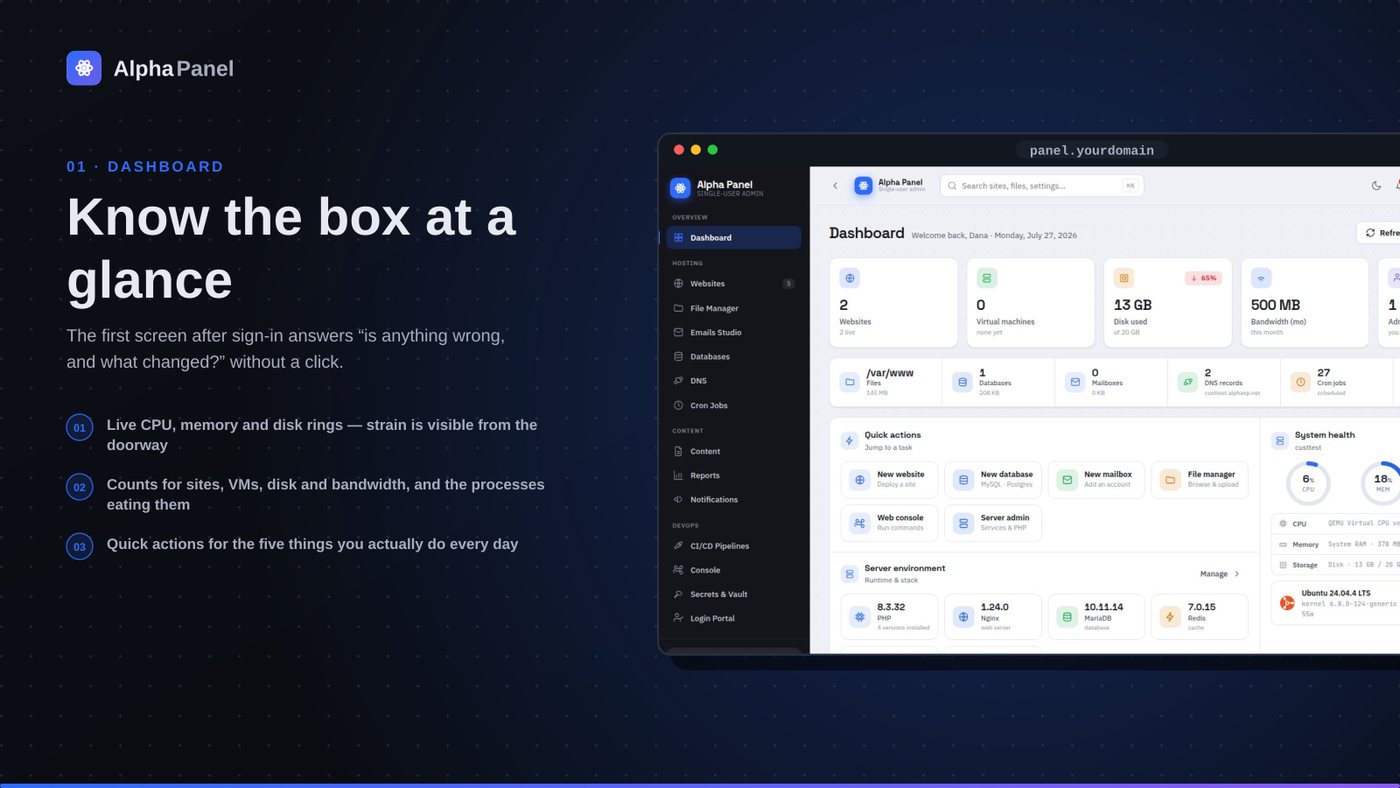
What a server dashboard should tell you (and what most of them don't)
A control panel's front page is the only screen most people ever look at. Here is what ours puts on it, why each number is there, and the ones we deliberately left off.
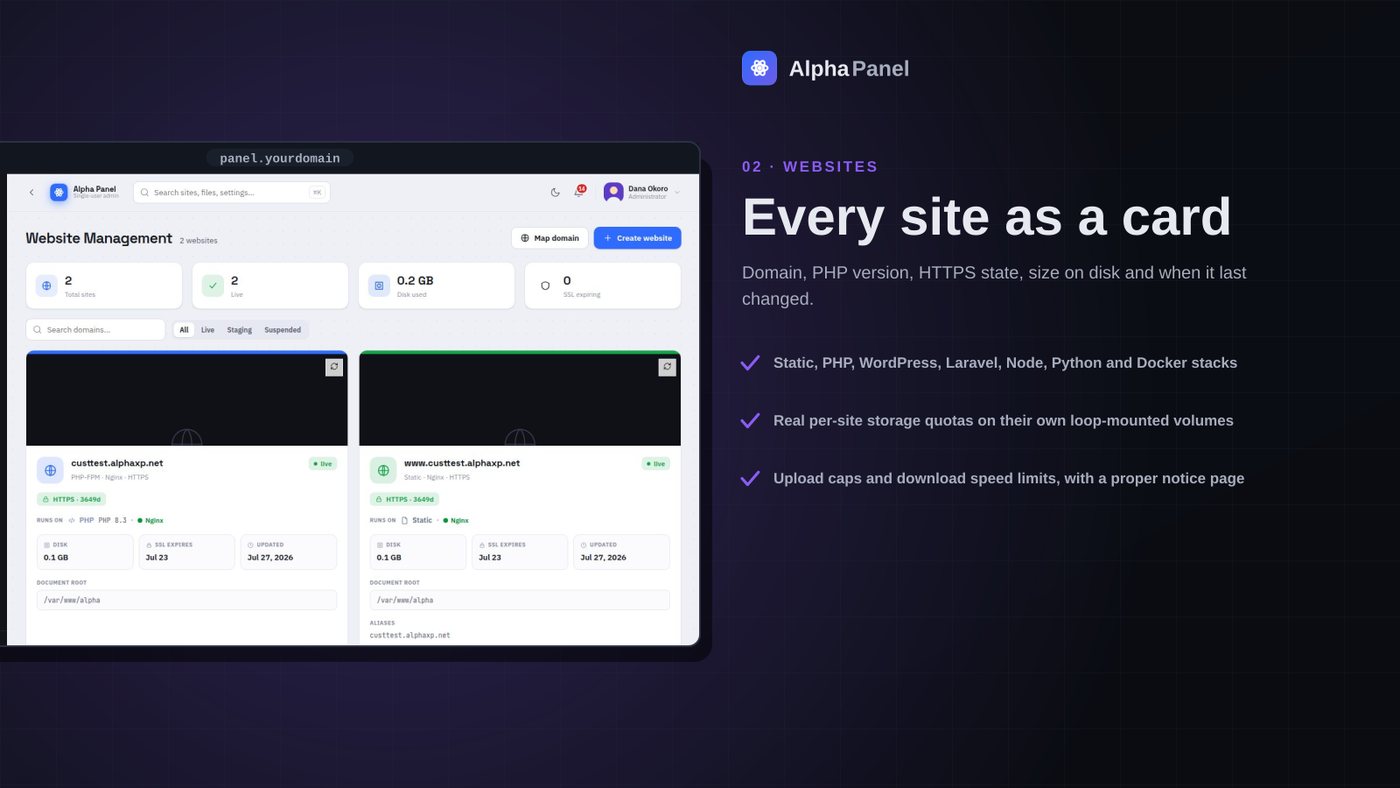
A storage limit that is actually a limit
Most per-site disk quotas in hosting panels are a number in a database that nothing enforces. We made ours a real filesystem the site cannot see past — here is what that took, and what it broke.
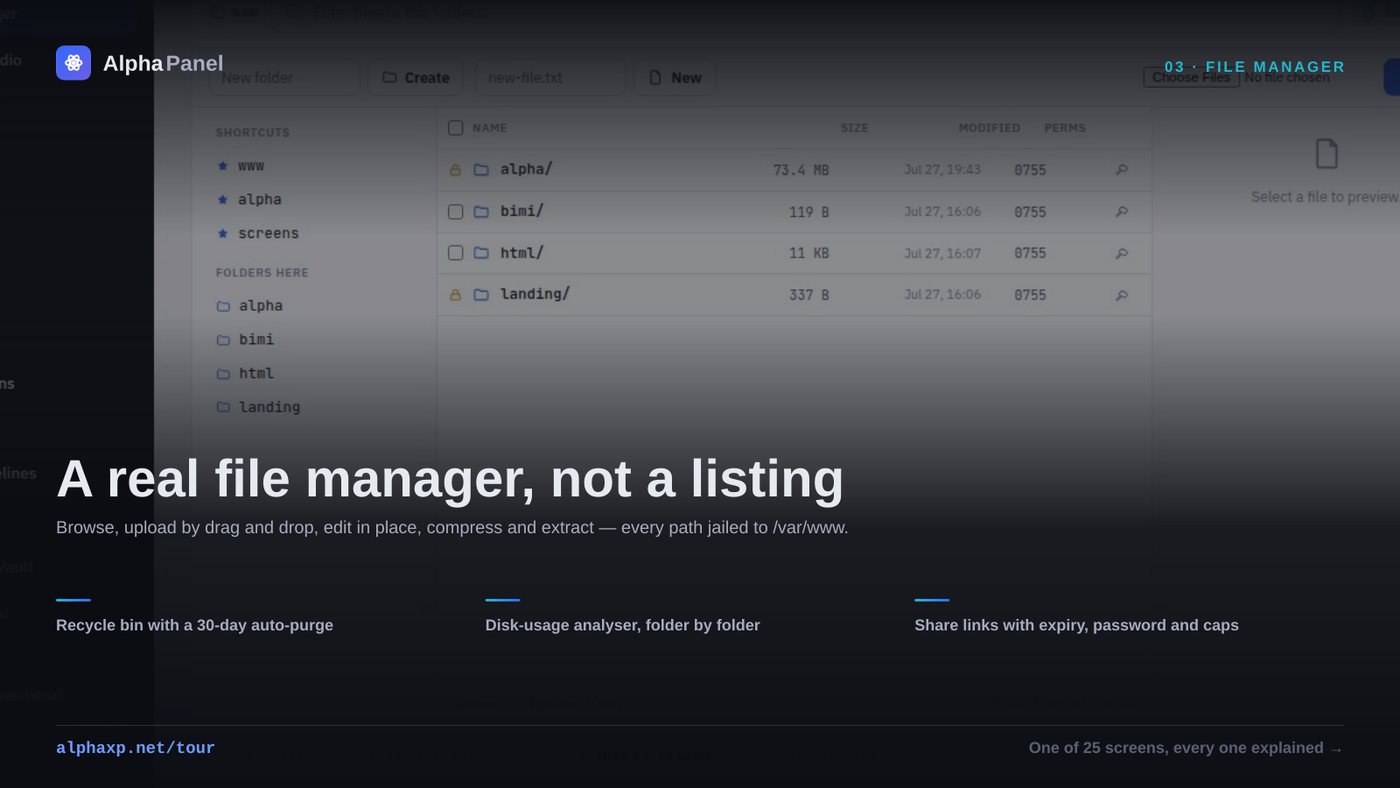
The delete that reported success and did nothing
A file manager is the most dangerous screen in a control panel. This is the bug that taught us that, plus what a browser-based file manager has to get right before anyone should trust it with a produc
Alpha Labs
We build Alpha Panel and run it on the same server it manages.