Uptime monitoring that tells you what actually happened
Every panel shows a green dot. Almost none can tell you how long you were down last month, or that a certificate expires on Tuesday.
In this essay
Every control panel tells you a service is running. Almost none of them can tell you whether it was running at 3am on the fourteenth, for how long it wasn't, or whether the certificate that quietly expired last Tuesday is the reason your checkout page stopped taking money.
That gap — between "green right now" and "here is what actually happened" — is what Uptime Monitor exists to close.
The difference between a status light and a monitor
Open the Services page of any control panel and you will see a row of green dots. Those dots are honest, as far as they go: they are the output of systemctl is-active, asked the moment you loaded the page. They tell you the process exists right now.
They do not tell you:
- whether the process was alive but not answering — an nginx that is running while PHP-FPM has run out of workers is a green dot in front of a 502
- whether it was down for four minutes last night and came back before anyone looked
- how long it has been down, in total, this month
- whether the thing your customers actually touch — the HTTPS endpoint, not the daemon — is reachable from outside the machine
A monitor answers those. It asks the same question on a schedule, from outside the process, writes the answer down, and keeps writing it down whether or not you are looking.
What it actually checks
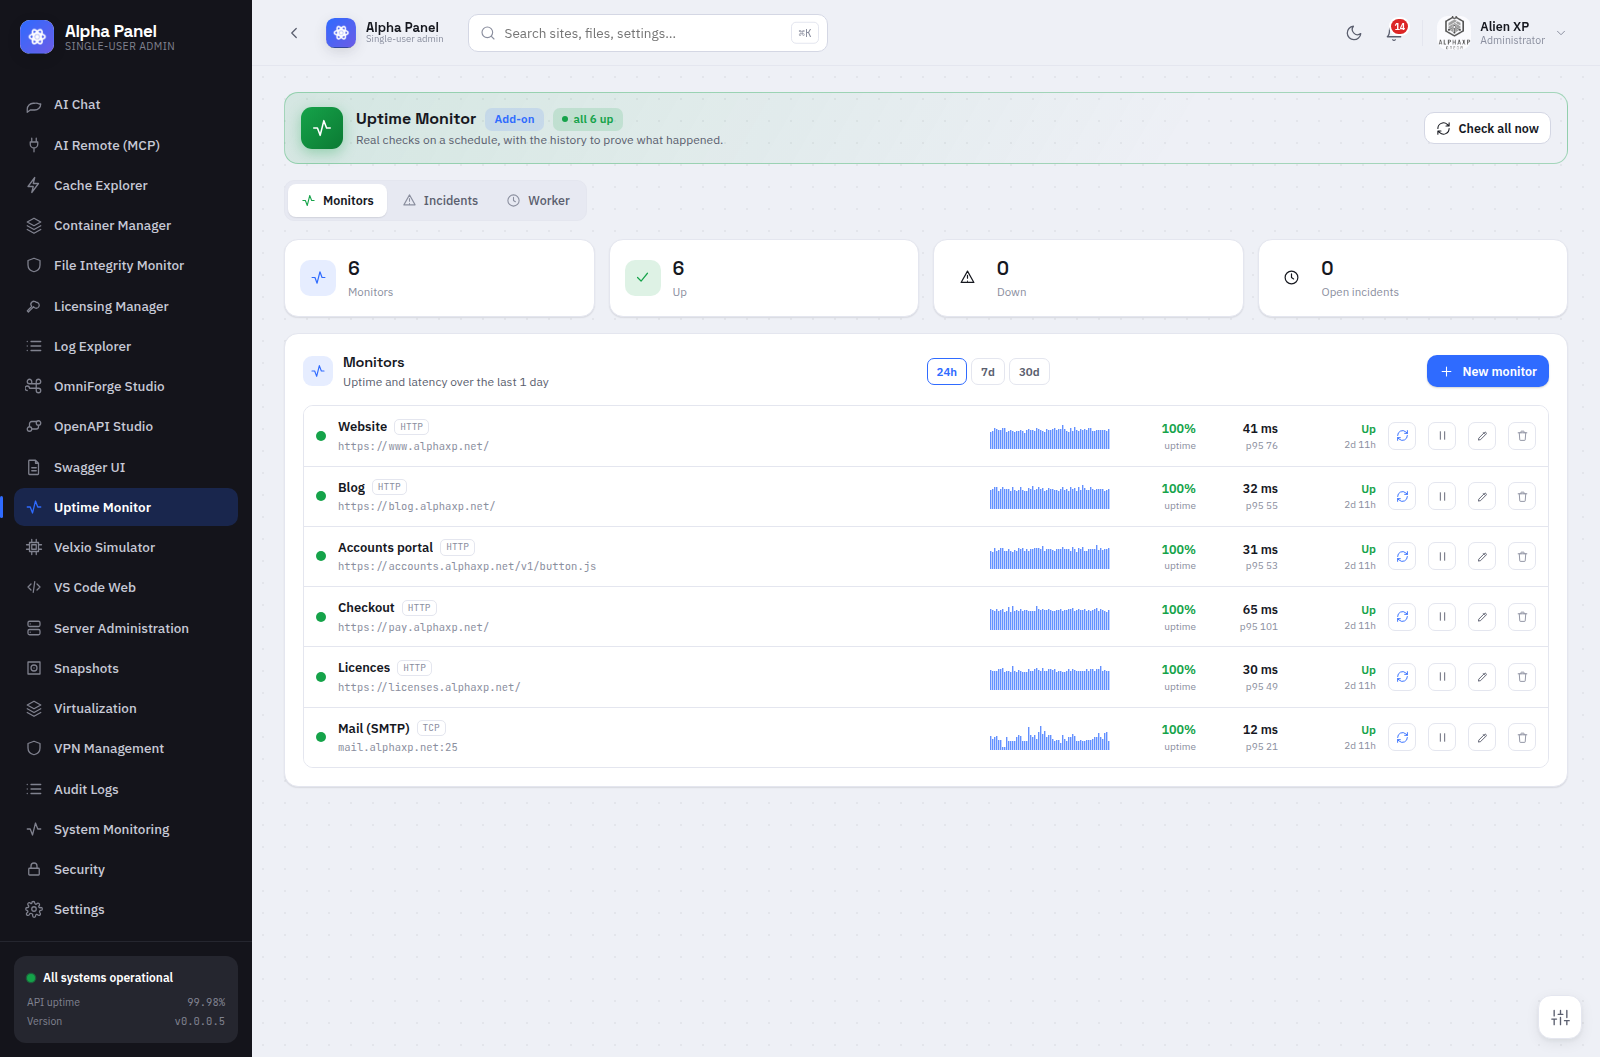
Uptime Monitor watches anything that answers on a port. In practice that is four shapes:
HTTP/HTTPS — a real request to a real URL. Not "is nginx up" but "does https://shop.example.com/checkout return 200". You can require a particular status code, and you can require that the response body contains a string, which is the difference between "the server replied" and "the server replied with the right page". A WordPress site serving a white screen of death returns a perfectly cheerful 200.
TCP — a connection to a port. Right for anything that speaks a protocol the monitor does not need to understand: SMTP on 25, IMAP on 993, MySQL on 3306, a game server, a Redis instance.
Ping (ICMP) — is the host reachable at all. The bluntest check and the one that tells you whether you are debugging an application or a network.
Certificate expiry — not a check in the usual sense, but the one that saves you most often. Every HTTPS monitor also reads the certificate and tells you how many days it has left, long before a browser starts showing your visitors a warning.
Each monitor has its own interval. A checkout page might be checked every minute; a staging box every fifteen. The worker is on a one-minute cron and skips anything that is not due, so the interval is a property of the monitor rather than something you have to reconfigure the schedule for.
Honest uptime percentages
This is where most monitoring gets quietly dishonest, and it is worth being precise about.
If you check something every five minutes and it was down for three minutes between checks, a naive monitor reports 100%. It never observed a failure, so as far as it knows nothing happened. Multiply that across a month and you get the uptime figures that appear on status pages: technically derived from real data, and meaningfully wrong.
Uptime Monitor reports what it observed and is explicit about the resolution it observed it at. An incident records when the first failed check happened and when the first successful check after it happened. The duration is the span between them — which is the outer bound of the outage, not a flattering estimate of it. If you check every five minutes, an incident can be up to five minutes longer than the truth on each end, and the honest thing to do is report the window you can actually defend.
The uptime percentage is computed from checks, not from incidents, so a monitor with 8,640 checks in a month and 12 failures reports 99.86% — a number you can trace back to individual rows.
The incident log
A failed check on its own is noise. Networks blip. A monitor that pages you for one dropped packet is a monitor you will mute within a week, and a muted monitor is worse than no monitor because it makes you feel covered.
So failures are grouped into incidents. An incident opens when a monitor fails, stays open while it keeps failing, and closes on the first success. What you get is a list of outages — with a start, an end, a duration and the error that was recorded — rather than a wall of individual failures.
That list is the artefact that matters. It is what you look at when a customer says "your site was down yesterday afternoon" and you need to know whether they are right. It is what you look at when you are deciding whether that flaky VPS is actually flaky or whether you have been blaming the wrong thing for three months.
Where it sits against other control panels
Being concrete about this is more useful than being polite about it.
cPanel and Plesk do not ship uptime monitoring in the sense described here. Both have service-status displays — the green dots — and both can restart a service that has died. Plesk has a Health Monitor for resource thresholds. Neither keeps an external check history, neither produces an incident log, and neither will tell you that a certificate expires in nine days. The usual answer in both ecosystems is to buy a third-party monitor and point it at the box.
Webmin/Virtualmin has System and Server Status, which is closer: it can check services and send email when one fails, and it can run on a schedule. What it does not do well is history. You get notified about the event; you do not get a month of latency data or a percentage you can put in front of a client.
CyberPanel and aaPanel both lean on service status plus resource graphs. aaPanel has monitoring plugins of varying quality, several of which are paid, and the data lives in whatever store the plugin chose.
The dedicated services — UptimeRobot, Better Stack, Pingdom, StatusCake — are genuinely good at this, and they have something Uptime Monitor structurally cannot have: they check from outside your network. If your server loses its uplink, an on-box monitor goes down with it and records nothing; an external service notices immediately. That is a real advantage and it would be dishonest to wave it away.
What an on-box monitor has instead is everything else: it can watch internal services that are not exposed to the internet at all, it costs nothing per monitor, it does not send your endpoint list to a third party, and its data is on a disk you control. In practice the two are complements. Run Uptime Monitor for the fifty internal things you would never pay per-monitor to watch, and put one free external check on the front door so you find out when the whole box goes dark.
The price difference
This is where the arithmetic gets uncomfortable for the incumbents.
UptimeRobot's free tier gives you 50 monitors at five-minute intervals; one-minute intervals and most of the useful features start at their paid plans, which run roughly $7–$34 a month depending on tier. Pingdom starts around $10 a month for 10 checks. Better Stack's paid tiers start around $25 a month. StatusCake sits in a similar band.
Take the middle of that: about $15 a month, or $180 a year, for the monitoring you would otherwise bolt onto your server.
Uptime Monitor is $19 a year, once, for unlimited monitors on that server.
The comparison is not perfectly like-for-like — again, the external vantage point is a real difference — but for the majority of what people actually monitor, which is their own services on their own box, the annual cost of the add-on is roughly what a hosted monitor costs for five weeks.
Against the panels rather than the monitors, the arithmetic is different but not friendlier. cPanel licensing for a single-account VPS is around $17–$20 a month at current list prices; Plesk Web Admin is around $12–$15. Neither number includes uptime monitoring, because neither product includes it.
What it does not do
Worth saying plainly, because a feature list that only lists strengths is a sales page rather than a description:
- It checks from this server. If the server is unreachable, it cannot tell you so.
- It does not do synthetic browser transactions — no "log in, add to cart, check out" scripted journeys.
- It has no multi-region checking, so it cannot tell you that your site is fast in Frankfurt and slow in São Paulo.
- Notifications go through the panel's own notification channels. It is not a full on-call product with escalation policies and rotas.
If you need any of those, you need a hosted monitoring service, and you should buy one.
Getting it running
Install it from the Marketplace inside the panel. It appears in the sidebar under Monitoring.
Add a monitor with a name, a type, a target and an interval. The first check runs on the next minute-tick rather than immediately, so give it sixty seconds before deciding it is broken. Latency history starts accumulating from that first check — there is no back-fill, because inventing data you never collected is exactly the dishonesty this whole feature is designed to avoid.
A reasonable starting set for most servers: the public site over HTTPS with a body match on something that only appears when the page rendered properly, the mail server on 25 or 587, the database on its port, and whichever internal service you have been bitten by before.
Then leave it alone for a month, and go and read the incident log. That reading is the entire product.
How the checks actually run
Worth understanding, because it explains both the guarantees and the limits.
A single cron entry fires the worker every minute. The worker loads the monitor list, works out which monitors are due based on their own interval and their last-checked timestamp, and runs only those. A monitor set to fifteen minutes costs nothing on the fourteen minutes it is not due.
The whole run is wrapped in flock -n. If a previous run is still going — because an endpoint is hanging and its check is sitting on a timeout — the new run exits immediately rather than starting a second copy. Without that lock, a single unreachable host with a long timeout will pile up runs until the box is executing dozens of simultaneous curls, and the monitoring becomes the outage. This is not a hypothetical failure mode; it is the most common way home-grown monitoring takes down the server it was supposed to protect.
Each check has its own timeout, and a timeout counts as a failure. That is deliberate: from a visitor's point of view there is no difference between a server that refuses a connection and one that accepts it and then never answers. Both are down.
Results are written as a fixed-width history per monitor rather than an ever-growing log. Old samples roll off the end. A year of one-minute checks on fifty monitors would be twenty-six million rows if you kept everything, and nobody has ever needed the individual latency of a check from eight months ago — they need the percentage, the incidents, and the recent detail. So recent history is kept at full resolution and older history is kept as daily aggregates.
What the data looks like after a month
The first week of monitoring is boring. Everything is green, the percentages all read 100%, and you will wonder what you bought.
The value shows up in month two, in three specific ways.
The p95 latency line. Average response time hides everything interesting. A page that answers in 40ms for 95 checks and 4 seconds for 5 checks has an average around 220ms, which looks fine. The p95 tells you that one request in twenty takes four seconds, and one request in twenty is a lot of customers. When a site "feels slow sometimes" and the average says it isn't, the p95 is where the argument gets settled.
The slow drift. Response times rarely fall off a cliff. They creep — 40ms in January, 55ms in March, 90ms in June — as a database grows, as a table loses an index, as a log file fills a disk. Nobody notices a creep in real time. You notice it on a 30-day chart with a 90-day one next to it.
The incidents you never knew about. Almost every server has them: a two-minute gap at 04:15 where a backup job saturated the disk, a weekly blip when logrotate restarts something, a handful of failures clustered on the day the provider migrated your VM without telling you. None of these generate a support ticket. All of them are visible in the incident log, and several of them are fixable in an afternoon once you can see them.
Certificate expiry deserves its own paragraph
Of everything in this add-on, the certificate check is the one most likely to earn its price in a single event.
Let's Encrypt certificates last ninety days and renew automatically, which works right up until it doesn't. A renewal fails when the ACME challenge path stops being reachable, when a cron got disabled during an unrelated bit of maintenance, when a DNS record moved, or when the certificate covers a hostname that no longer resolves. In every one of those cases the renewal fails quietly, weeks before anyone notices, and the first sign of trouble is a browser full-page warning on a production site.
Every HTTPS monitor reads the certificate on each check and records the days remaining. Long before expiry — while there is still plenty of time to fix the underlying cause calmly — the number is sitting there on the screen, counting down. It is a small feature and it is the sort of thing that turns a Saturday-morning emergency into a Tuesday-afternoon task.
Who this is for
If you run one server with one site on it and you already have a free external monitor pointed at the front page, this add-on is a nice-to-have.
If you run a handful of services where most of them are not public — a database, an internal API, a mail server, a queue worker, a staging environment — then a per-monitor hosted service either gets expensive or gets skipped, and "gets skipped" is how you end up finding out about problems from a customer. That is the case this is built for: enough monitors that paying per monitor stops making sense, and enough internal services that an external monitor cannot see them anyway.
And if you are hosting for clients, the uptime percentage and the incident log are the two artefacts that turn "the server was fine" into something you can actually show someone.